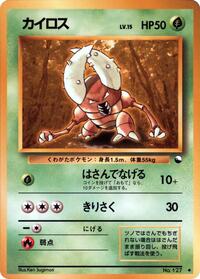
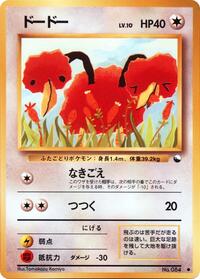
Vending Machine cards Series 1 (Blue)
0 cards · 36 sealed products
Sealed productstop 24 of 36 by value · all sealed
| Card | Market | 7d | 30d | 90d |
|---|---|---|---|---|
| $411.33 | 0.0% | +20.3% | ||
| $216.66 | 0.0% | +0.8% | ||
| $169.99 | +3.0% | +6.3% | ||
| $133.16 | 0.0% | +2.4% | ||
| $126.67 | 0.0% | +1.3% | ||
| $112.07 | +1.6% | +1.6% | ||
| $96.40 | 0.0% | +1.1% | ||
| $92.48 | +10.1% | +10.1% | ||
| $91.66 | 0.0% | 0.0% | ||
| $57.20 | 0.0% | 0.0% | ||
| $46.47 | +9.2% | +33.3% | ||
| $45.37 | 0.0% | +3.5% | ||
| $45.00 | 0.0% | 0.0% | ||
| $43.31 | 0.0% | +5.7% | ||
| $42.49 | 0.0% | 0.0% | ||
| $36.67 | +4.8% | +22.2% | ||
| $34.22 | +9.2% | +12.4% | ||
| $33.60 | +13.9% | +13.9% | ||
| $33.54 | +10.3% | +16.3% | ||
| $29.74 | — | +19.4% | ||
| $29.31 | +20.9% | +26.1% | ||
| $28.28 | 0.0% | -2.5% | ||
| $27.55 | 0.0% | 0.0% | ||
| $24.90 | — | 0.0% |
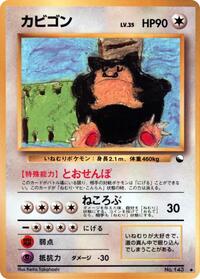
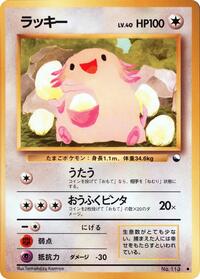
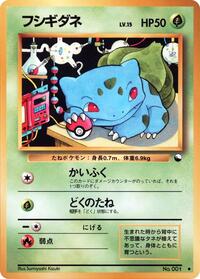
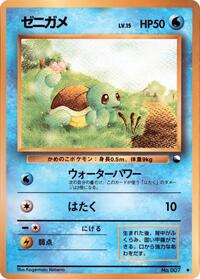
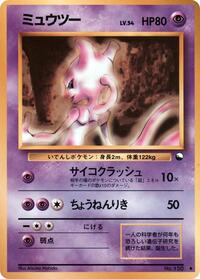

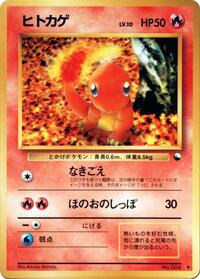
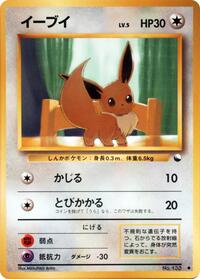
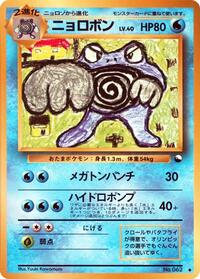

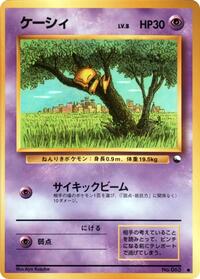
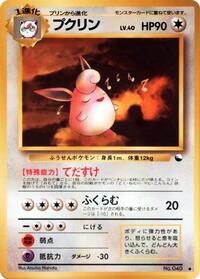



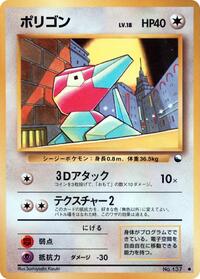
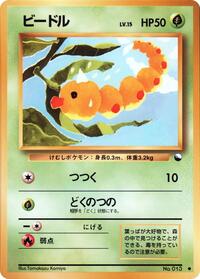

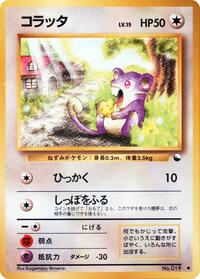
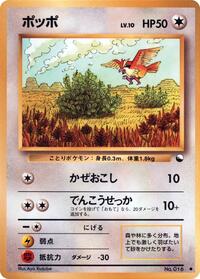
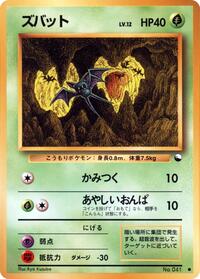
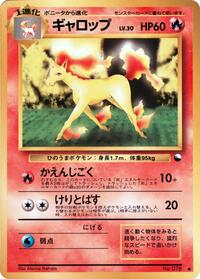
Vending Machine cards Series 1 (Blue) sealed
32 sealed products in the sample · rebased to 100 at 2025-03-05- 30d
- +7.4%
- 90d
- +35.1%
- 1y
- +97.8%
- All
- +182.8%
- Level
- 312.2
2025-03-052026-08-30
Weekly chain-linked index. Each step compares only sealed products priced in BOTH of the two weeks, so items appearing or delisting cannot move the line — 10.6% of a fixed basket went dark over the last eleven months, and a level computed over whoever reported today would follow that instead of prices. An item must clear $5 in both weeks of a step to count: without a floor, penny rounding dominates. The line is the longest unbroken run of weeks with enough matched pairs — a week too thin to measure truncates it rather than being bridged over. Scoped to this set, using the same construction as the market index. How this is built.